teuto
  • Communities
  • Create Post
  • Create Community
  • heart
    Support Lemmy
  • search
    Search
  • Login
  • Sign Up
RadioFreeArabia@lemmy.cafe to Map Enthusiasts@sopuli.xyzEnglish · 1 year ago

The Top 20 Planet Wrecker Countries by Expansion Emissions 2023 - 2050

lemmy.cafe

message-square
13
link
fedilink
0

The Top 20 Planet Wrecker Countries by Expansion Emissions 2023 - 2050

lemmy.cafe

RadioFreeArabia@lemmy.cafe to Map Enthusiasts@sopuli.xyzEnglish · 1 year ago
message-square
13
link
fedilink

source: https://priceofoil.org/2023/09/12/planet-wreckers-how-20-countries-oil-and-gas-extraction-plans-risk-locking-in-climate-chaos/

alert-triangle
You must log in or register to comment.
  • Jimmybander@champserver.net
    link
    fedilink
    arrow-up
    1
    ·
    1 year ago

    So the consumers of oil are good. Just the producers are bad. This is the boogeyman in map form.

    • RadioFreeArabia@lemmy.cafeOP
      link
      fedilink
      English
      arrow-up
      0
      arrow-down
      3
      ·
      1 year ago

      The US is also the biggest consumer ahead of China.

  • 1rre@discuss.tchncs.de
    link
    fedilink
    arrow-up
    1
    ·
    edit-2
    1 year ago

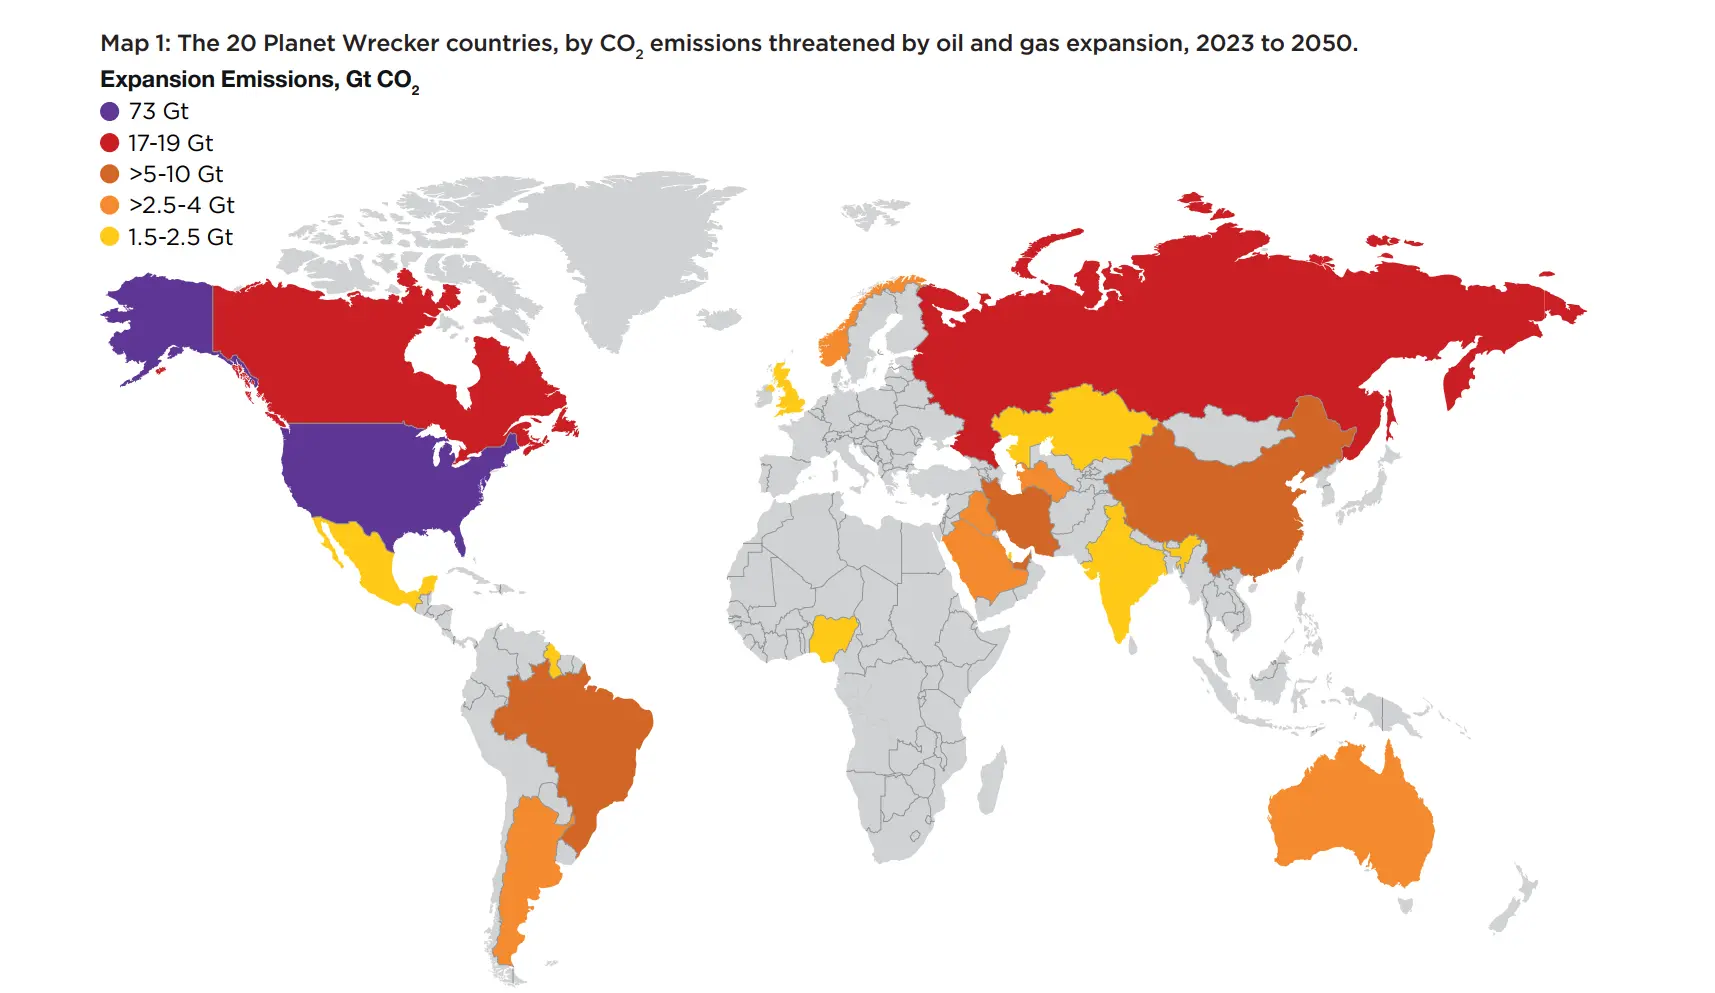
    This is so niche… Not current production, not future production, not emissions, just the difference between production now and production later seemingly designed to give the middle east and Venezuela a pass because they’re already producing a crazy amount

    • RadioFreeArabia@lemmy.cafeOP
      link
      fedilink
      English
      arrow-up
      0
      arrow-down
      5
      ·
      edit-2
      1 year ago

      The US is the biggest producer now ahead of Russia and Saudi Arabia, Venezuela is at 21st. This post is about future production expansion.

  • Skua@kbin.earth
    link
    fedilink
    arrow-up
    0
    ·
    1 year ago

    This is obivously not the actual point of the map, but why have a bunch of countries in Central Africa merged? It looks like Angola, both Congos, Gabon, and Equatorial Guinea

    • RadioFreeArabia@lemmy.cafeOP
      link
      fedilink
      English
      arrow-up
      0
      arrow-down
      5
      ·
      1 year ago

      I didn’t notice, good catch. I wonder if it is an aliasing/resolution issue.

  • SkyNTP@lemmy.ml
    link
    fedilink
    English
    arrow-up
    0
    ·
    1 year ago

    It’s essentially a map of big countries (population, territory, population density…)

    This map would be way more interesting if it was normalized per capita or some other meaningful denominator. Only then does it make sense to point fingers.

    • volodya_ilich@lemm.ee
      link
      fedilink
      arrow-up
      1
      ·
      1 year ago

      China and India have 5 times the population of the USA, and yet are 1 order of magnitude or more below the USA. You’re not making sense here

    • Specal@lemmy.world
      link
      fedilink
      arrow-up
      0
      ·
      1 year ago

      UK has a higher population than Canada but had a lower rating on this scale. So that’s not strictly true.

      • originalfrozenbanana@lemm.ee
        link
        fedilink
        arrow-up
        0
        ·
        1 year ago

        Not to mention India and China vs. the US

        Total emissions would tell a different story but population is not the only factor here

        • Specal@lemmy.world
          link
          fedilink
          arrow-up
          0
          arrow-down
          1
          ·
          1 year ago

          A few of the dimwits I work with use china alot as a reason to not do anything about climate change because they keep building coal plants but… The coal plants they build are more efficient.

          According to this chart the UK is doing well but we can still do better and we should keep doing more.

  • nxdefiant@startrek.website
    link
    fedilink
    arrow-up
    0
    ·
    1 year ago

    This map, but for coal, tells a far worse story.

    • RadioFreeArabia@lemmy.cafeOP
      link
      fedilink
      English
      arrow-up
      0
      arrow-down
      3
      ·
      1 year ago

      This map is about future oil and gas expansion. You can see the list of countries by past and present coal production here https://en.wikipedia.org/wiki/List_of_countries_by_coal_production

Map Enthusiasts@sopuli.xyz

map_enthusiasts@sopuli.xyz

Subscribe from Remote Instance

Create a post
You are not logged in. However you can subscribe from another Fediverse account, for example Lemmy or Mastodon. To do this, paste the following into the search field of your instance: !map_enthusiasts@sopuli.xyz

For the map enthused!

Rules:

  • post relevant content: interesting, informative, and/or pretty maps

  • be nice

Visibility: Public
globe

This community can be federated to other instances and be posted/commented in by their users.

  • 223 users / day
  • 831 users / week
  • 2.21K users / month
  • 5.72K users / 6 months
  • 1 local subscriber
  • 4.59K subscribers
  • 272 Posts
  • 4.53K Comments
  • Modlog
  • mods:
  • zksmk@sopuli.xyz
  • garfaagel@sh.itjust.works
  • BE: 0.19.11
  • Modlog
  • Instances
  • Docs
  • Code
  • join-lemmy.org